A Simple RHPAM-Application Integration with Multi User Approval Workflow

On this article, im trying to create a simple Leave Approval System which is deployed as microservices. So basically there are two different application, one Golang app as Frontend, and RHPAM (Red Hat Process Automation Manager) as Backend, and both are communicating by using a simple REST API.

Basically there are two users involved here, one is adminUser as requester, and spv02 as approver. As approver, spv02 can either accept or reject the requested leave. Easiest way to described the approval workflow is perhaps described in below image,

Lets start by creating two user on RHPAM,

adminUser / password
spv02 / password

Import project from github (code is at the end of this article), build and deployed it to KIE.

Now lets start with creating an entry form,

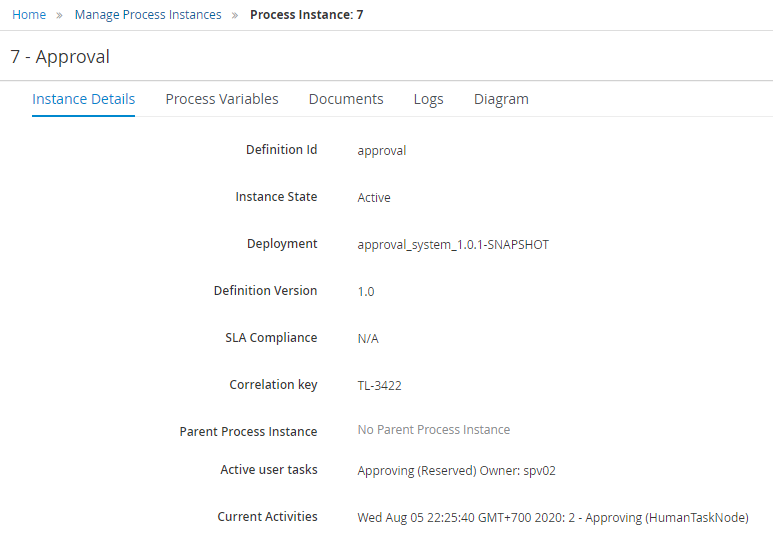
The touch-point between frontend and pam on this ui is RHPAM’s “process instances” API, and im adding a correlation-key which is a unique business primary key.

curl -L -X POST 'http://localhost:8080/kie-server/services/rest/server/containers/approval_system_1.0.1-SNAPSHOT/processes/approval/instances/correlation/TL-3422' \
-H 'Authorization: Basic YWRtaW5Vc2VyOnBhc3N3b3Jk' \
-H 'Content-Type: application/json' \
--data-raw '{
    "application": {
        "com.myspace.approval_system.Request": {
            "days": 9,
            "purpose":"Sick Leave"
        }
    }
}'

Next step is displaying all leave request that have been made by this corresponding user, we can capture this by using server queries API, given a specific username as initiator parameter,

curl -L -X GET 'http://localhost:8080/kie-server/services/rest/server/queries/processes/instances?initiator=adminUser&page=0&pageSize=10&sortOrder=true&status=1&status=2&status=3' \
-H 'Accept: application/json' \
-H 'Authorization: Basic YWRtaW5Vc2VyOnBhc3N3b3Jk'

Moving forward, now we are seeing from approval’s point of view, first we need to display what are the tasks which are assign to this user.

curl -L -X GET 'http://localhost:8080/kie-server/services/rest/server/queries/tasks/instances/owners?page=0&pageSize=10&sortOrder=true&sort=taskId' \
-H 'Accept: application/json' \
-H 'Authorization: Basic c3B2MDI6cGFzc3dvcmQ='

And the ability to Approve or Reject a specific request, there are two APIs which are involved here. That is one API for starting the task, and another one to complete it. Make sure you differentiate parameters on “approved” field, use “false” for Rejecting request, and “true” for Accepting request.

curl -L -X PUT 'http://localhost:8080/kie-server/services/rest/server/containers/approval_system_1.0.1-SNAPSHOT/tasks/6/states/started' \
-H 'Authorization: Basic c3B2MDI6cGFzc3dvcmQ='
curl -L -X PUT 'http://localhost:8080/kie-server/services/rest/server/containers/approval_system_1.0.1-SNAPSHOT/tasks/6/states/completed' \
-H 'Authorization: Basic c3B2MDI6cGFzc3dvcmQ=' \
-H 'Content-Type: application/json' \
--data-raw '{
    "approved": false
}'

And here are my repositories on Github,

frontend : 
https://github.com/edwin/frontend-for-approval-rhpam

backend :
https://github.com/edwin/rhpam-simple-approval-concept

Have fun playing with RHPAM 🙂

Installing Prometheus and Grafana on Top of Openshift 4

Creating and deploying application on top of Openshift is one thing, but doing health monitoring for those applications is a whole new different thing. Thats why on this session im trying to share on how to deploy Prometheus, for monitoring appliction statistics, and Grafana, for visualizing it, to support the day-to-day activity and operations.

So before started too far, lets start with a brief introduction on what is Prometheus and Grafana.

According to its site (https://prometheus.io/), Prometheus is an open-source systems monitoring and alerting toolkit. It has multiple visualization tools and Grafana as one of it. On Grafana’s website, https://grafana.com/, we can see that it is an open source visualization and analytics software, which allows us to query, visualize, alerting and explore our metrics freely.

Okay, there are multiple ways of installing those two items. One way is by using Openshift Operator, and another way is installed it manually either by using template, or a simple container image installation. For this time, we are using the last approach, and that is container image deployment.

Lets start by installing Prometheus first,

for this example, im using openshift/prometheus image from docker hub.

Once image has been created, next is creating a configuration file for storing list of prometheus api needed to be scrape from, for this example im scrapping statistics from application App01 which located on project Project01 on top of the same OCP4 instance.

global:
  scrape_interval: 15s
  scrape_timeout: 10s
  evaluation_interval: 15s
alerting:
  alertmanagers:
  - static_configs:
    - targets: []
    scheme: http
    timeout: 10s
scrape_configs:
- job_name: project01
  scrape_interval: 15s
  scrape_timeout: 10s
  metrics_path: /metrics
  scheme: http
  static_configs:
  - targets:
    - app01.project01.svc.cluster.local:8080
  basic_auth:
      username: dev01
      password: password

Save it with name “prometheus.yml”, and push it to OCP4 secret by using below command

oc create cm prometheus-config --from-file=prometheus.yaml

And mount it to Prometheus’s DeploymentConfig

oc volume dc/prometheus --add --name=prometheus-config --type=configmap --configmap-name=prometheus-config --mount-path=/etc/prometheus/

Expose your installed Prometheus service, and access it directly thru browser. A successfully installation will shows a target end point like this,

Next step is to install Grafana. The same installation methodology is being use, and that is using container image deployment. Im using grafana/grafana:6.0.1 image from DockerHub for this example.

Login by using admin/admin credentials,

Set the datasource as prometheus,

Add prometheus url and scrape interval, and press Save button

We can start by creating a Grafana dashboard based on Prometheus statistics,

There is other approach of installating Prometheus and Grafana, and that is by using yml template. I cover those approach on my Github page,

https://github.com/edwin/prometheus-and-grafana-openshift4-template-yml

Have fun.

Logging and Circuit Breaker Mechanism with Hystrix on Red Hat Fuse

Red Hat have a middleware product called Red Hat Fuse, both Red hat Fuse it and Apache Camel as its OpenSource project are well known products for a message-oriented middleware and integration platform. Functionality-wise, there are no huge difference between those two (Fuse and Camel) besides of support, so sometimes it is a good approach to test the opensource version first before going with the supported one.

Right now, we are trying to create a simple Camel script which is doing a proxy request to a third party api. But we are doing some enhancement on the script, so it will not be just a reverse proxy but added with more features such as logging, statistics and a circuit breaker mechanism. We are adding both logging and statistics for seeing the healthiness of our api and third party api endpoints, while circuit braker is being use for handling scenarios where there a latency or slowness happen on our third party api.

The underlying concept is drawn on below diagram,

Okay, so lets start by creating a Fuse application with maven,

<?xml version="1.0" encoding="UTF-8"?>
<project xmlns="http://maven.apache.org/POM/4.0.0"
         xmlns:xsi="http://www.w3.org/2001/XMLSchema-instance"
         xsi:schemaLocation="http://maven.apache.org/POM/4.0.0 http://maven.apache.org/xsd/maven-4.0.0.xsd">
    <modelVersion>4.0.0</modelVersion>

    <groupId>com.edw</groupId>
    <artifactId>HttpLoggingAndCircuitBreaker</artifactId>
    <version>1.0-SNAPSHOT</version>

    <properties>
        <project.build.sourceEncoding>UTF-8</project.build.sourceEncoding>
        <fuse.version>7.2.0.fuse-720020-redhat-00001</fuse.version>
    </properties>

    <dependencyManagement>
        <dependencies>
            <dependency>
                <groupId>org.jboss.redhat-fuse</groupId>
                <artifactId>fuse-springboot-bom</artifactId>
                <version>${fuse.version}</version>
                <type>pom</type>
                <scope>import</scope>
            </dependency>
        </dependencies>
    </dependencyManagement>

    <dependencies>
        <dependency>
            <groupId>org.apache.camel</groupId>
            <artifactId>camel-spring-boot-starter</artifactId>
        </dependency>
        <dependency>
            <groupId>org.springframework.boot</groupId>
            <artifactId>spring-boot-starter-web</artifactId>
        </dependency>
        <dependency>
            <groupId>org.springframework.boot</groupId>
            <artifactId>spring-boot-starter-actuator</artifactId>
        </dependency>
        <dependency>
            <groupId>org.apache.camel</groupId>
            <artifactId>camel-http-starter</artifactId>
        </dependency>
        <dependency>
            <groupId>org.apache.camel</groupId>
            <artifactId>camel-servlet-starter</artifactId>
        </dependency>
        <dependency>
            <groupId>org.apache.camel</groupId>
            <artifactId>camel-hystrix-starter</artifactId>
        </dependency>

        <dependency>
            <groupId>com.netflix.archaius</groupId>
            <artifactId>archaius-core</artifactId>
            <version>0.7.1</version>
        </dependency>

        <dependency>
            <groupId>org.springframework.cloud</groupId>
            <artifactId>spring-cloud-starter-hystrix-dashboard</artifactId>
            <version>1.4.7.RELEASE</version>
            <exclusions>
                <exclusion>
                    <groupId>com.netflix.archaius</groupId>
                    <artifactId>archaius-core</artifactId>
                </exclusion>
            </exclusions>
        </dependency>

        <dependency>
            <groupId>org.springframework.cloud</groupId>
            <artifactId>spring-cloud-starter-hystrix</artifactId>
            <version>1.4.7.RELEASE</version>
            <exclusions>
                <exclusion>
                    <groupId>com.netflix.archaius</groupId>
                    <artifactId>archaius-core</artifactId>
                </exclusion>
            </exclusions>
        </dependency>
    </dependencies>

    <build>
        <pluginManagement>
            <plugins>
                <plugin>
                    <groupId>org.jboss.redhat-fuse</groupId>
                    <artifactId>spring-boot-maven-plugin</artifactId>
                    <version>${fuse.version}</version>
                </plugin>
            </plugins>
        </pluginManagement>
        <plugins>
            <plugin>
                <artifactId>maven-compiler-plugin</artifactId>
                <configuration>
                    <source>8</source>
                    <target>8</target>
                </configuration>
            </plugin>
        </plugins>
    </build>
</project>

And two simple rest api, written in Camel XML format, first is a simple hello world rest api, while the second one is a much more complex app which involved circuit breaking and logging,

<?xml version="1.0" encoding="UTF-8"?>
<rest path="/hello-world" xmlns="http://camel.apache.org/schema/spring">
    <get>
        <route>
            <setHeader headerName="Content-Type">
                <constant>application/json</constant>
            </setHeader>
            <setBody>
                <simple>{ "hello": "world" }</simple>
            </setBody>
        </route>
    </get>
</rest>
<?xml version="1.0" encoding="UTF-8"?>
<rest path="/circuit-breaker" xmlns="http://camel.apache.org/schema/spring">
    <post>
        <route>
            <setHeader headerName="timestamp">
                <simple>${bean:java.lang.System?method=currentTimeMillis}</simple>
            </setHeader>

            <hystrix>
                <!--
                    a message which exceed 1000ms will considered as timeout, and trigger fallback method.
                    It need a 5 timeouts in last ten seconds to trigger a 5000ms circuit break, before trying to re-connect again.
                -->
                <hystrixConfiguration executionTimeoutInMilliseconds="1000"
                                      circuitBreakerSleepWindowInMilliseconds="5000"
									  metricsRollingStatisticalWindowInMilliseconds="10000"
                                      circuitBreakerRequestVolumeThreshold="5" />
                <to uri="https://run.mocky.io/v3/bc6c24ff-d124-401f-bf84-31e0c6366af6?httpClient.soTimeout=1000&amp;bridgeEndpoint=true" />
                <onFallback>
                    <!--  reversal example when a message is considered timeout by hystrix -->
                    <doTry>
                        <to uri="https://run.mocky.io/v3/4eb219a6-a7b1-40b8-90e1-230052fc5823?httpClient.soTimeout=1000&amp;bridgeEndpoint=true" />

                        <doCatch>
                            <exception>java.lang.Exception</exception>
                            <bean ref="logHandler" method="logError('on catch')"/>
                        </doCatch>
                        <doFinally>
                            <setBody>
                                <simple>{ "hello": "fallback" }</simple>
                            </setBody>
                        </doFinally>
                    </doTry>
                </onFallback>
            </hystrix>

            <bean ref="logHandler" method="logTimestamp(${header.timestamp})"/>
        </route>
    </post>
</rest>

The first api is quite self-explanatory, use below curl to do testing

curl -kv http://localhost:8080/api/hello-world

But we are focusing to the second API, which is much more complicated because it consist of a circuit breaker functionality which will do a 5 seconds break if there are more than 5 errors on the last 10 seconds. Perhaps diagram below can help simplifying the basic concept,

And can test that url with this code,

curl -kv http://localhost:8080/api/circuit-breaker -X POST --header "Content-Type: application/json" --data '{"username":"xyz","password":"xyz"}'

Next is creating a surrounding support system for this app, such as a hystrix dashboard for displaying how much transaction is failing, response time average, circuit status and error percentage, and a hystrix stream for providing those data. In order to activate hystrix dashboard and stream, we need to register it on our project.

package com.edw;

import org.apache.camel.component.hystrix.metrics.servlet.HystrixEventStreamServlet;
import org.springframework.boot.SpringApplication;
import org.springframework.boot.autoconfigure.SpringBootApplication;
import org.springframework.boot.web.servlet.ServletRegistrationBean;
import org.springframework.cloud.client.circuitbreaker.EnableCircuitBreaker;
import org.springframework.cloud.netflix.hystrix.dashboard.EnableHystrixDashboard;
import org.springframework.context.annotation.Bean;

@EnableCircuitBreaker
@EnableHystrixDashboard
@SpringBootApplication
public class Application {
    public static void main(String[] args) {
        SpringApplication.run(Application.class, args);
    }

    @Bean
    public HystrixEventStreamServlet hystrixServlet() {
        return new HystrixEventStreamServlet();
    }

    @Bean
    public ServletRegistrationBean servletRegistrationBean() {
        return new ServletRegistrationBean(new HystrixEventStreamServlet(), "/hystrix.stream");
    }
}

By default, we can see our hystrix dashboard on this url

http://localhost:8080/hystrix

Fill the data,

And see the result,

One other thing is that we can monitor the statistic and trace http history for our Camel by using our Actuator api,

curl -kv http://localhost:8080/metrics

curl -kv http://localhost:8080/trace

One thing that is worth mentioning is that we can see how much response time for each API from our Actuator trace API, which by default gives last 100 http request. For example below, it took 297ms for our API to give a response.

Lastly, we can see my code on below github url.

https://github.com/edwin/fuse-logging-circuit-breaker

Good luck, and have fun with Camel and Circuit Breaker.

Building Containerized Images on Openshift 4 and Push the Result to Third Party Image Registry

Sometimes in our pipeline, we need to build a docker images based on a specific Dockerfile and push the result to an external Image Registry such as Quay, Docker Hub or even on-premise Nexus or JFrog.

On this example, im trying to simulate build a simple java application, containerized it, and push it to Quay. The rough concept can be seen below,

1. Jenkins pull latest java code from Github, do testing and Maven build
2. Containerizing Maven build result and push it to Quay
3. Openshift Pre-Prod and Prod will pull from Quay, if build result is considered stable enough

For this example, im using a simple Dockerfile,

FROM registry.access.redhat.com/ubi8/ubi-minimal:8.0

MAINTAINER Muhammad Edwin < edwin at redhat dot com >

LABEL BASE_IMAGE="registry.access.redhat.com/ubi8/ubi-minimal:8.0"
LABEL JAVA_VERSION="11"

RUN microdnf install --nodocs java-11-openjdk-headless && microdnf clean all

WORKDIR /work/
COPY target/*.jar /work/application.jar

EXPOSE 8080
CMD ["java", "-jar", "application.jar"]

And build it in a Jenkins pipeline, on this example im deploying to Quay

node('maven') {
    stage ('pull code') {
        sh "git clone https://github.com/edwin/hello-world-java-docker.git source"
    }
    stage ('mvn build') {
        dir("source") {
            sh "mvn clean package"
        }
    }
    stage ('build and push') {
        dir("source") {
            sh "oc new-build --strategy docker --name=hello-world-java-docker \
                        --binary --to-docker \
                        --to=quay.io/edwinkun/hello-world-java-docker || true"
            sh "oc start-build hello-world-java-docker --from-dir=. --follow --wait "
        }
    }
}

One thing you need to remember is that we need to register our Quay credentials in order to be able to push there. And we can achieve it by using this command,

oc create secret docker-registry --docker-server=quay.io \
	--docker-username=edwinkun --docker-password=******* \
	--docker-email=unused \
	quay-login

oc secrets link default quay-login

Run our Jenkins pipeline and we can see the result on Jenkins dashboard,

When successfully deployed, we can see the pipeline log result will be like this,

And lastly we can see that the containerized image is successfully deployed to Quay

Code for above example can be found on this Github link,

https://github.com/edwin/hello-world-java-docker

A Simple Load Testing Pipeline on Openshift 4 and Jenkins

Theres one thing needed to be done before deploying your app to production environment, and that is ensuring that your app able to perform well under a high load of transaction. One way to achieve that is by doing a load testing and stress testing internally before deploying to production, but there are times when load testing are being done at the end of development phase with not many time left for developer to do performance tuning. Therefore the better approach is by “shifting left” both load and stress testing phase to an earlier phase, and that is since development phase.

The concept on this blog is doing a load testing on a temporary deployed application, with a maximum one percent acceptable fail. Why i need to deploy the application first before doing a load testing? Because im trying to simulate the exact same condition with production, where each application is a standalone pod, with a specific memory and cpu allocation.

Everything is automated, monitored and managed thru jenkins pipeline with a specific load testing scenario created separatedly in a regular JMeter desktop ui, saved and mapped to a specific application. The detail can be see on on below image where scenario 1 is a scenario created for application 1.

The hard part is creating a JMeter application that is able to consume different scenario, with a parameterized thread and testing endpoint. Thats why im leveraging jmeter-maven-plugin for this, because it’s so lightweight and have a dynamic configuration.

It consist only a one pom file with multiple parameterized fields,

<?xml version="1.0" encoding="UTF-8"?>
<project xmlns="http://maven.apache.org/POM/4.0.0"
         xmlns:xsi="http://www.w3.org/2001/XMLSchema-instance"
         xsi:schemaLocation="http://maven.apache.org/POM/4.0.0 http://maven.apache.org/xsd/maven-4.0.0.xsd">
    <modelVersion>4.0.0</modelVersion>

    <groupId>com.edw</groupId>
    <artifactId>JMeterLoadTesting</artifactId>
    <version>1.0-SNAPSHOT</version>
    <name>JMeterLoadTesting</name>
    <description>A Load Testing tool</description>

    <properties>
        <java.version>11</java.version>
    </properties>

    <dependencies>

    </dependencies>

    <build>
        <plugins>
            <plugin>
                <groupId>com.lazerycode.jmeter</groupId>
                <artifactId>jmeter-maven-plugin</artifactId>
                <version>3.1.0</version>
                <executions>
                    <execution>
                        <id>configuration</id>
                        <goals>
                            <goal>configure</goal>
                        </goals>
                    </execution>
                    <execution>
                        <id>jmeter-tests</id>
                        <phase>integration-test</phase>
                        <goals>
                            <goal>jmeter</goal>
                        </goals>
                    </execution>
                    <execution>
                        <id>jmeter-check-results</id>
                        <goals>
                            <goal>results</goal>
                        </goals>
                    </execution>
                </executions>
                <configuration>
                    <testFilesIncluded>
                        <jMeterTestFile>${testfile}</jMeterTestFile>
                    </testFilesIncluded>
                    <propertiesJMeter>
                        <threads>${threads}</threads>
                        <rampup>${rampup}</rampup>
                        <loops>${loops}</loops>
                        <url>${url}</url>
                        <port>${port}</port>
                    </propertiesJMeter>
                    <errorRateThresholdInPercent>1</errorRateThresholdInPercent>
                </configuration>
            </plugin>
        </plugins>
    </build>
</project>

Next is we need to create a JMeter test scenario, a simple http GET to root url. And save it to test01.jmx, and put it on /test/jmeter folder so that jmeter-maven-plugin can detect this scenario.

We can test our JMeter script with below command, below example we are running test01.jmx which is doing a 25 hit testing within a 5 seconds timeframe.

mvn clean verify -Dthreads=5 -Dloops=5 -Drampup=5 \
 -Durl=localhost -Dport=8080 -Dtestfile=test01.jmx

The next complicated task is to create a simple Jenkins pipeline script to run this. It needs to have the ability to build and deploy an apps on a temporary pod, do load testing, and clean all resources once load testing is done.

node('maven2') {
    def appname = "app-loadtest-${env.BUILD_NUMBER}"
    try {
        stage ('pull code') {
            sh "git clone https://github.com/edwin/app-loadtest.git source"
        }
        stage ('deploy to ocp') {
            dir("source") {
                sh "oc new-build jenkins2/openjdk-11-rhel7 --name=${appname} --binary "
                sh "oc start-build ${appname} --from-dir=. --follow --wait"
                sh "oc new-app --docker-image=image-registry.openshift-image-registry.svc:5000/jenkins2/${appname}:latest --name=${appname} || true"
                sh "oc set resources dc ${appname} --limits=cpu=500m,memory=1024Mi --requests=cpu=200m,memory=256Mi"
            }
        }
        stage ('do load test') {
            sh "git clone https://github.com/edwin/jmeter-loadtesting.git load"
            dir("load") {
                // 5 threads x 5 loops in 5 seconds
                sh "mvn clean verify -Dthreads=5 -Dloops=5 -Drampup=5 -Durl=${appname} -Dport=8080 -Dtestfile=test01.jmx"
            }
        }
    } catch (error) {
       throw error
    } finally {
        stage('housekeeping') {
            sh "oc delete svc ${appname}"
            sh "oc delete bc ${appname}"
            sh "oc delete is ${appname}"
            sh "oc delete dc ${appname}"
        }
    }
}

If we run the pipeline, we can see that it will spawn an appication pod. We can check whether application runs perfectly or not, by running terminal directly inside it.

The result on Jenkins Dashboard will be like this,

As for the loadtest result, we can see those on our Jenkins logs

All codes are available on github,

https://github.com/edwin/app-loadtest

https://github.com/edwin/jmeter-loadtesting

So, have fun with Jenkins and JMeter 🙂