prometheus

Integrating Infinispan, Prometheus, and Grafana

Infinispan 14, or its supported product which is Red Hat DataGrid 8.4, is already having a metrics endpoint API to be parsed and visualized. And on this article, we are trying to integrate those metrics with Prometheus and Grafana, and Generate a dashboard to displayed its statistics in almost real-time update.

The highlevel design perhaps would looks like this,

First we can start by starting 3 different Infinispan instances, we can use multiple ways of doing this such as with docker or podman, but for this scenario im creating 3 different folders which each contains a Red Hat DataGrid instances. Make sure to create a port offset to prevent their port from colliding, and change the servername for an easier maintenance.

$ cd ~/Documents/redhat-datagrid-8.4.6-server-1/bin
$ ./server.sh -c infinispan.xml

$ cd ~/Documents/redhat-datagrid-8.4.6-server-2/bin
$ ./server.sh -c infinispan.xml

$ cd ~/Documents/redhat-datagrid-8.4.6-server-3/bin
$ ./server.sh -c infinispan.xml

Once all those 3 started, we can try to login to one server and see wheter those 3 servers already form a cluster.

we can start by creating replicated or distributed caches on top of our newly created Infinispan cluster.

Next is creating Prometheus instance, and to make this activity easier, we are going to using Podman. Lets start with a prometheus.yaml file first, in here we need to define the location of our Infinispan instances. Im using “host.containers.internal” because Prometheus is running on a container, and going to access Infinspan instances which are running on the host instance.

# my global config
global:
  scrape_interval: 15s 
  evaluation_interval: 15s 
  

# Alertmanager configuration
alerting:
  alertmanagers:
    - static_configs:
        - targets:
          # - alertmanager:9093

scrape_configs:  
  - job_name: "ispn01"
    static_configs:
      - targets: ["host.containers.internal:11222"]
  - job_name: "ispn02"
    static_configs:
      - targets: ["host.containers.internal:11223"]
  - job_name: "ispn03"
    static_configs:
      - targets: ["host.containers.internal:11224"]

And run our Prometheus using Podman,

podman run \
           -p 9090:9090 \
           -v /Users/Shared/prometheus.yml:/etc/prometheus/prometheus.yml \
           --network shared  \
		   prom/prometheus

We can validate whether our Prometheus runs well or not by accessing it page and do some queries,

Once successfully started, we can continue by installing our Grafana instance using Podman,

podman run  \
			-p 3000:3000 \ 
			--network shared \  
			grafana/grafana-enterprise

After that, we can access Grafana Dashboard directly

Next is setting-up Prometheus Datasource inside Grafana, where we need to put the name of our datasource, and also its connection URL. For this sample, we are putting Prometheus container’s IP inside.
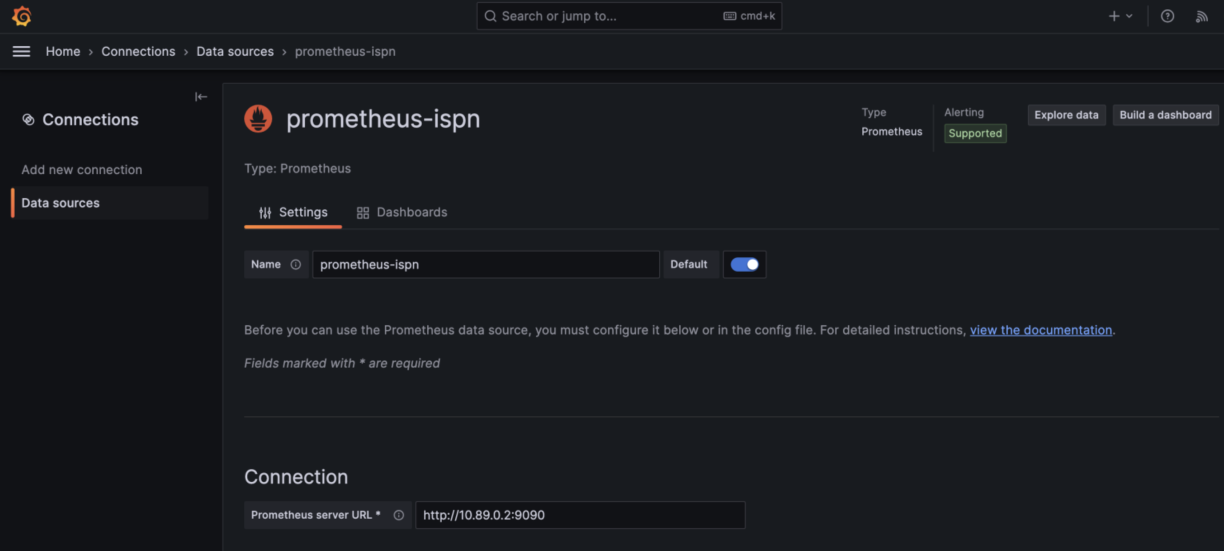
Make sure we copy the uid of this Datasource (we can see it at the browser’s URL), since we are going to use it in the dashboard.

Next is to create a new Grafana Dashboard for Infinispan, we can use import functionality to import existing dashboard in the form of a json file. For this sample, we can download from below Github repository.

https://github.com/edwin/infinispan-grafana-dashboard/

Dont forget to replace the existing hardcoded datasource uid with our existing Datasource uid

"datasource": {
        "type": "prometheus",
        "uid": "eb756797-79c7-4893-bcc9-c4bfdc7c457d"
      },

Save, and we can see our Grafana Dashboard

Exposing Openshift Prometheus API and Display it on External Monitoring Tools

Theres one question comes up during discussion with my colleague regarding on how we can monitor our application which are being deployed on top of Openshift. Actually Openshift has its own monitoring tools, but sometimes we need an external monitoring tools for monitor our distributed application especially when deployed in a multiple different clusters of Openshift.

In the end, the high level concept is pretty much like this.

But first in order to achieve it we need to make sure that our thanos-querier are both accesible by External Grafana, and also secure.

Before we go there, lets start by creating an “mw” namespace first and deploying a simple java apps there.

oc new-project mw

oc new-app registry.access.redhat.com/ubi8/openjdk-8~https://github.com/edwin/hello-world-fuse-on-ocp -n mw

Create a new serviceaccount,

oc create sa ext-monitor -n mw

And gives a “cluster-monitoring-view” role to it,

oc adm policy add-cluster-role-to-user cluster-monitoring-view -z ext-monitor -n mw

Next step is getting the ServiceAccount JWT token by using below command,

oc sa get-token ext-monitor -n mw

It will generate something like this, and save it somewhere.

Next is setuping our own External Monitoring tools by using grafana, and login with admin/admin credential.

docker pull grafana/grafana

docker run -d -p 3000:3000 grafana/grafana

Create a new Data sources, and select Prometheus as our new Datasource.

Fill in some data, and put our thanos-querier as our HTTP URL.

Create new HTTP Header, and put Authorization as the Key. And put “Bearer (your ServiceAccount JWT token)” as the value. We can add some custom query parameters for defining which namespace to be monitored.

Press Save and Test button after.

Next step is creating a dashboard,

And an empty Panel,

Change our Data source into our newly created Data source, and run below query in Metric Browser field

sum(node_namespace_pod_container:container_cpu_usage_seconds_total:sum_rate{namespace='mw'}) by (pod)

The result should be seen on below image,

Fyi, on this tutorial Im using Openshift 4.8.

Securing Quarkus Metric API

Usually im creating a metrics API for displaying statistics and various metrics which are being use for measuring application healthiness. There are various tools that being use to capturing this statistics and displaying it, one example is using Prometheus and Grafana.

But on this example, we are not talking too much detail about Prometheus and Grafana, but more on how we providing those metrics on top of Quaskus while securing it so that no malicious user can access this metric API easily.

Lets start with a simple pom file,

<?xml version="1.0" encoding="UTF-8"?>
<project xmlns="http://maven.apache.org/POM/4.0.0"
         xmlns:xsi="http://www.w3.org/2001/XMLSchema-instance"
         xsi:schemaLocation="http://maven.apache.org/POM/4.0.0 http://maven.apache.org/xsd/maven-4.0.0.xsd">
    <modelVersion>4.0.0</modelVersion>

    <groupId>QuarkusPrometheus</groupId>
    <artifactId>com.edw</artifactId>
    <version>1.0-SNAPSHOT</version>

    <properties>
        <quarkus.version>1.6.1.Final</quarkus.version>
        <project.build.sourceEncoding>UTF-8</project.build.sourceEncoding>
        <surefire-plugin.version>2.22.1</surefire-plugin.version>
        <maven.compiler.source>8</maven.compiler.source>
        <maven.compiler.target>8</maven.compiler.target>
    </properties>

    <dependencyManagement>
        <dependencies>
            <dependency>
                <groupId>io.quarkus</groupId>
                <artifactId>quarkus-bom</artifactId>
                <version>${quarkus.version}</version>
                <type>pom</type>
                <scope>import</scope>
            </dependency>
        </dependencies>
    </dependencyManagement>

    <dependencies>
        <dependency>
            <groupId>io.quarkus</groupId>
            <artifactId>quarkus-resteasy</artifactId>
        </dependency>
        <dependency>
            <groupId>io.quarkus</groupId>
            <artifactId>quarkus-resteasy</artifactId>
        </dependency>

        <dependency>
            <groupId>io.quarkus</groupId>
            <artifactId>quarkus-smallrye-metrics</artifactId>
        </dependency>
        <dependency>
            <groupId>io.quarkus</groupId>
            <artifactId>quarkus-smallrye-health</artifactId>
        </dependency>
        <dependency>
            <groupId>io.quarkus</groupId>
            <artifactId>quarkus-elytron-security-properties-file</artifactId>
        </dependency>

        <dependency>
            <groupId>io.quarkus</groupId>
            <artifactId>quarkus-junit5</artifactId>
            <scope>test</scope>
        </dependency>
        <dependency>
            <groupId>io.rest-assured</groupId>
            <artifactId>rest-assured</artifactId>
            <scope>test</scope>
        </dependency>
    </dependencies>

    <build>
        <plugins>
            <plugin>
                <artifactId>maven-surefire-plugin</artifactId>
                <version>${surefire-plugin.version}</version>
                <configuration>
                    <systemProperties>
                        <java.util.logging.manager>org.jboss.logmanager.LogManager</java.util.logging.manager>
                    </systemProperties>
                </configuration>
            </plugin>
            <plugin>
                <groupId>io.quarkus</groupId>
                <artifactId>quarkus-maven-plugin</artifactId>
                <version>${quarkus.version}</version>
                <executions>
                    <execution>
                        <goals>
                            <goal>build</goal>
                        </goals>
                    </execution>
                </executions>
            </plugin>
        </plugins>
    </build>
</project>

And a very simple application.properties for storing all my configurations, in here we can see that we are defining a specific role for accessing our metrics endpoint.

#port
quarkus.http.port=8082

#security
quarkus.security.users.embedded.enabled=true
quarkus.security.users.embedded.plain-text=true
quarkus.security.users.embedded.users.admin=password
quarkus.security.users.embedded.roles.admin=prom-role

quarkus.http.auth.policy.prom-policy.roles-allowed=prom-role

quarkus.http.auth.permission.prom-roles.policy=prom-policy
quarkus.http.auth.permission.prom-roles.paths=/metrics

run by using below command,

compile quarkus:dev

Try opening our metrics url directly,

We can try to login by using a specific username and password,

admin / password

If successfully login, we can see this view

One interesting thing is that we can use a different url for Kubernetes’s health and liveness probe check, without have to use any credential at all.

Sourcecode for this example can be downloaded on below url,

https://github.com/edwin/quarkus-secure-prometheus-api

Have fun with Quarkus 🙂

Installing Prometheus and Grafana on Top of Openshift 4

Creating and deploying application on top of Openshift is one thing, but doing health monitoring for those applications is a whole new different thing. Thats why on this session im trying to share on how to deploy Prometheus, for monitoring appliction statistics, and Grafana, for visualizing it, to support the day-to-day activity and operations.

So before started too far, lets start with a brief introduction on what is Prometheus and Grafana.

According to its site (https://prometheus.io/), Prometheus is an open-source systems monitoring and alerting toolkit. It has multiple visualization tools and Grafana as one of it. On Grafana’s website, https://grafana.com/, we can see that it is an open source visualization and analytics software, which allows us to query, visualize, alerting and explore our metrics freely.

Okay, there are multiple ways of installing those two items. One way is by using Openshift Operator, and another way is installed it manually either by using template, or a simple container image installation. For this time, we are using the last approach, and that is container image deployment.

Lets start by installing Prometheus first,

for this example, im using openshift/prometheus image from docker hub.

Once image has been created, next is creating a configuration file for storing list of prometheus api needed to be scrape from, for this example im scrapping statistics from application App01 which located on project Project01 on top of the same OCP4 instance.

global:
  scrape_interval: 15s
  scrape_timeout: 10s
  evaluation_interval: 15s
alerting:
  alertmanagers:
  - static_configs:
    - targets: []
    scheme: http
    timeout: 10s
scrape_configs:
- job_name: project01
  scrape_interval: 15s
  scrape_timeout: 10s
  metrics_path: /metrics
  scheme: http
  static_configs:
  - targets:
    - app01.project01.svc.cluster.local:8080
  basic_auth:
      username: dev01
      password: password

Save it with name “prometheus.yml”, and push it to OCP4 secret by using below command

oc create cm prometheus-config --from-file=prometheus.yaml

And mount it to Prometheus’s DeploymentConfig

oc volume dc/prometheus --add --name=prometheus-config --type=configmap --configmap-name=prometheus-config --mount-path=/etc/prometheus/

Expose your installed Prometheus service, and access it directly thru browser. A successfully installation will shows a target end point like this,

Next step is to install Grafana. The same installation methodology is being use, and that is using container image deployment. Im using grafana/grafana:6.0.1 image from DockerHub for this example.

Login by using admin/admin credentials,

Set the datasource as prometheus,

Add prometheus url and scrape interval, and press Save button

We can start by creating a Grafana dashboard based on Prometheus statistics,

There is other approach of installating Prometheus and Grafana, and that is by using yml template. I cover those approach on my Github page,

https://github.com/edwin/prometheus-and-grafana-openshift4-template-yml

Have fun.