Infinispan 14, or its supported product which is Red Hat DataGrid 8.4, is already having a metrics endpoint API to be parsed and visualized. And on this article, we are trying to integrate those metrics with Prometheus and Grafana, and Generate a dashboard to displayed its statistics in almost real-time update.
The highlevel design perhaps would looks like this,

First we can start by starting 3 different Infinispan instances, we can use multiple ways of doing this such as with docker or podman, but for this scenario im creating 3 different folders which each contains a Red Hat DataGrid instances. Make sure to create a port offset to prevent their port from colliding, and change the servername for an easier maintenance.
$ cd ~/Documents/redhat-datagrid-8.4.6-server-1/bin
$ ./server.sh -c infinispan.xml

$ cd ~/Documents/redhat-datagrid-8.4.6-server-2/bin
$ ./server.sh -c infinispan.xml

$ cd ~/Documents/redhat-datagrid-8.4.6-server-3/bin
$ ./server.sh -c infinispan.xml
Once all those 3 started, we can try to login to one server and see wheter those 3 servers already form a cluster.

we can start by creating replicated or distributed caches on top of our newly created Infinispan cluster.
Next is creating Prometheus instance, and to make this activity easier, we are going to using Podman. Lets start with a prometheus.yaml file first, in here we need to define the location of our Infinispan instances. Im using “host.containers.internal” because Prometheus is running on a container, and going to access Infinspan instances which are running on the host instance.
# my global config
global:
  scrape_interval: 15s
  evaluation_interval: 15s


# Alertmanager configuration
alerting:
  alertmanagers:
    - static_configs:
        - targets:
          # - alertmanager:9093

scrape_configs:
  - job_name: "ispn01"
    static_configs:
      - targets: ["host.containers.internal:11222"]
  - job_name: "ispn02"
    static_configs:
      - targets: ["host.containers.internal:11223"]
  - job_name: "ispn03"
    static_configs:
      - targets: ["host.containers.internal:11224"]
And run our Prometheus using Podman,
podman run \
           -p 9090:9090 \
           -v /Users/Shared/prometheus.yml:/etc/prometheus/prometheus.yml \
           --network shared  \
		   prom/prometheus
We can validate whether our Prometheus runs well or not by accessing it page and do some queries,

Once successfully started, we can continue by installing our Grafana instance using Podman,
podman run  \
			-p 3000:3000 \
			--network shared \
			grafana/grafana-enterprise
After that, we can access Grafana Dashboard directly

Next is setting-up Prometheus Datasource inside Grafana, where we need to put the name of our datasource, and also its connection URL. For this sample, we are putting Prometheus container’s IP inside.
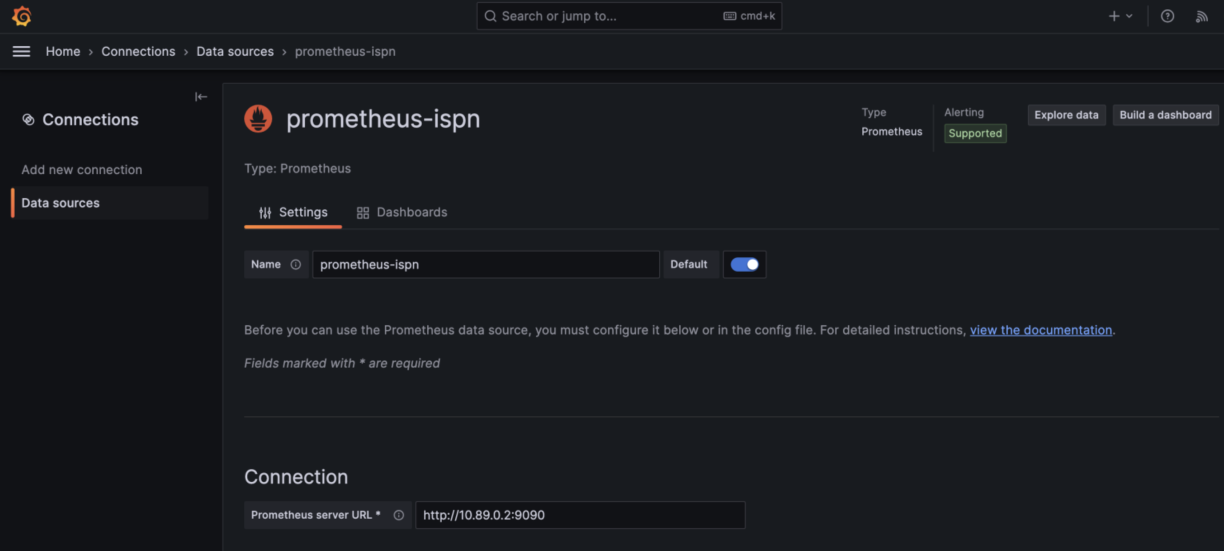
Make sure we copy the uid of this Datasource (we can see it at the browser’s URL), since we are going to use it in the dashboard.
Next is to create a new Grafana Dashboard for Infinispan, we can use import functionality to import existing dashboard in the form of a json file. For this sample, we can download from below Github repository.
https://github.com/edwin/infinispan-grafana-dashboard/
Dont forget to replace the existing hardcoded datasource uid with our existing Datasource uid
"datasource": {
        "type": "prometheus",
        "uid": "eb756797-79c7-4893-bcc9-c4bfdc7c457d"
      },
Save, and we can see our Grafana Dashboard


