edwin

Setting Up Custom Maven Repository with a Relative Folder

There are times where we want to build our application while pointing our library to a specific custom folder, which is having a relative folder location to current project Java folder.

For example, i have a Java project and a Libs folder with structure like below

libs/
+--- org
|   +--- postgresql
|   |   +--- postgresql
|   |   |   +--- random.version
|   |   |   |   +--- postgresql-random.version.jar

java_project/
+--- pom.xml
+--- src
|   +--- main
|   |   +--- java

We can build our java_project by refering to libs folder by using this configuration on our pom.xml

    <repositories>
        <repository>
            <id>local-repo</id>
            <name>Local Repository</name>
            <url>file://${project.basedir}/../libs</url>
        </repository>
    </repositories>

And refer it

	<dependency>
		<groupId>org.postgresql</groupId>
		<artifactId>postgresql</artifactId>
		<version>random.version</version>
	</dependency>

Running maven build command will display the complete build log where library is coming from our relative folder location,

$ mvn clean package

.......

Downloading from local-repo: file:///source/java_project/../libs/org/postgresql/postgresql/random.version/postgresql-random.version.jar
[WARNING] Could not validate integrity of download from file:///source/java_project/../libs/org/postgresql/postgresql/random.version/postgresql-random.version.jar: Checksum validation failed, no checksums available
[WARNING] Checksum validation failed, no checksums available from local-repo for file:///source/java_project/../libs/org/postgresql/postgresql/random.version/postgresql-random.version.jar
Downloaded from local-repo: file:///source/java_project/../libs/org/postgresql/postgresql/random.version/postgresql-random.version.jar (1.0 MB at 7.0 MB/s)

Distributed Tracing with Spring Boot, Infinispan, and Jaeger

Distributed Tracing with Spring Boot, Infinispan, and Jaeger

Infinispan 14, or Datagrid 8.4, has the capability to implement a distributed tracing which will make distributed tracing easier and providing a better end-to-end view.

The concept of distributed tracing perhaps looks like this,

For this example, we are going to use Spring Boot 3 and OpenTelemetry for client side, and Jaeger all-in-one on for monitoring. So lets start with a simple pom.xml

<?xml version="1.0" encoding="UTF-8"?>
<project xmlns="http://maven.apache.org/POM/4.0.0"
         xmlns:xsi="http://www.w3.org/2001/XMLSchema-instance"
         xsi:schemaLocation="http://maven.apache.org/POM/4.0.0 http://maven.apache.org/xsd/maven-4.0.0.xsd">
    <modelVersion>4.0.0</modelVersion>

    <groupId>com.edw</groupId>
    <artifactId>spring-boot-infinispan-and-jaeger</artifactId>
    <version>1.0</version>

    <name>Spring Boot 3 with OpenTelemetry and Jaeger</name>
    <description>Spring Boot testing app with opentelemetry</description>

    <parent>
        <groupId>org.springframework.boot</groupId>
        <artifactId>spring-boot-starter-parent</artifactId>
        <version>3.0.5</version>
        <relativePath/> <!-- lookup parent from repository -->
    </parent>

    <properties>
        <maven.compiler.source>17</maven.compiler.source>
        <maven.compiler.target>17</maven.compiler.target>
        <project.build.sourceEncoding>UTF-8</project.build.sourceEncoding>

        <version.infinispan>14.0.2.Final</version.infinispan>
        <version.protostream>4.6.2.Final</version.protostream>
    </properties>

    <dependencyManagement>
        <dependencies>
            <dependency>
                <groupId>org.infinispan</groupId>
                <artifactId>infinispan-bom</artifactId>
                <version>${version.infinispan}</version>
                <type>pom</type>
                <scope>import</scope>
            </dependency>
        </dependencies>
    </dependencyManagement>

    <dependencies>
        <dependency>
            <groupId>org.springframework.boot</groupId>
            <artifactId>spring-boot-starter-actuator</artifactId>
        </dependency>
        <dependency>
            <groupId>org.springframework.boot</groupId>
            <artifactId>spring-boot-starter-web</artifactId>
        </dependency>

        <dependency>
            <groupId>org.springframework.boot</groupId>
            <artifactId>spring-boot-starter-test</artifactId>
            <scope>test</scope>
        </dependency>

        <!-- tracing -->
        <dependency>
            <groupId>io.micrometer</groupId>
            <artifactId>micrometer-tracing-bridge-otel</artifactId>
        </dependency>
        <dependency>
            <groupId>io.opentelemetry</groupId>
            <artifactId>opentelemetry-exporter-otlp</artifactId>
        </dependency>

        <!-- infinispan -->
        <dependency>
            <groupId>org.infinispan</groupId>
            <artifactId>infinispan-spring-boot-starter-remote</artifactId>
        </dependency>
        <dependency>
            <groupId>org.infinispan</groupId>
            <artifactId>infinispan-query</artifactId>
        </dependency>
        <dependency>
            <groupId>org.infinispan</groupId>
            <artifactId>infinispan-remote-query-client</artifactId>
        </dependency>
        <dependency>
            <groupId>org.infinispan</groupId>
            <artifactId>infinispan-api</artifactId>
        </dependency>

        <dependency>
            <groupId>org.infinispan</groupId>
            <artifactId>infinispan-spring-boot-starter-embedded</artifactId>
        </dependency>

        <dependency>
            <groupId>org.infinispan.protostream</groupId>
            <artifactId>protostream-processor</artifactId>
            <scope>provided</scope>
        </dependency>
        <dependency>
            <groupId>org.infinispan</groupId>
            <artifactId>infinispan-client-hotrod</artifactId>
        </dependency>
        <dependency>
            <groupId>javax.transaction</groupId>
            <artifactId>jta</artifactId>
            <version>1.1</version>
        </dependency>

    </dependencies>

    <build>
        <plugins>
            <plugin>
                <groupId>org.springframework.boot</groupId>
                <artifactId>spring-boot-maven-plugin</artifactId>
            </plugin>
        </plugins>
    </build>

</project>

Next is some Java classes,

@SpringBootApplication
public class Main {
    public static void main(String[] args) {
        SpringApplication.run(Main.class, args);
    }
}
@RestController
public class IndexController {

    private static final Logger logger = LoggerFactory.getLogger(IndexController.class);

    @Autowired
    private IndexService indexService;

    @GetMapping("/")
    public ResponseEntity path1() {

        logger.info("request at / ");
        indexService.createData();
        return ResponseEntity.ok().build();
    }

}
@Service
public class IndexService {

    @Autowired
    private RemoteCacheManager cacheManager;

    @Autowired
    private Tracer tracer;

    private Logger logger = LoggerFactory.getLogger(this.getClass());

    public void createData() {
        logger.info("starting ====================");

        // starting span
        Span span = tracer.spanBuilder()
                .name("cache-add")
                .tag("cache", "balance")
                .kind(Span.Kind.CLIENT).start();

        final RemoteCache cache = cacheManager.getCache("balance");

        // generate cache key
        String key = UUID.randomUUID().toString();

        // put it
        cache.put(key, Math.random());

        // get it -- somehow this is not monitored in Jaeger
        Double value = Double.parseDouble((String)cache.get(key));

        // and remove it
        cache.remove(key);

        span.end();

        logger.info("done processing {} - {} ====================", key, value);
    }
}
@Configuration
public class OtlpConfiguration {

    @Bean
    public OtlpHttpSpanExporter otlpHttpSpanExporter() {
        return OtlpHttpSpanExporter.builder()
                .build();
    }

}
@Configuration
public class InfinispanConfiguration {
    @Bean
    public RemoteCacheManager remoteCacheManager() {
        return new RemoteCacheManager(
                new org.infinispan.client.hotrod.configuration.ConfigurationBuilder()
                        .addServers("127.0.0.1:11222")
                        .security().authentication().username("admin").password("password")
                        .clientIntelligence(ClientIntelligence.HASH_DISTRIBUTION_AWARE)
                        .marshaller(ProtoStreamMarshaller.class)
                        .build());
    }
}
server.port=8080
spring.application.name=app-testing

management.tracing.sampling.probability=1.0
management.otlp.metrics.export.url=http://localhost:4318/v1/traces
management.otlp.metrics.export.step=5s

logging.pattern.level=%5p [${spring.application.name:},%X{traceId:-},%X{spanId:-}]

Once we have all Java classes ready, we’ll continue with setting Jaeger server up. We’ll need

docker run -d \ 
        -e COLLECTOR_OTLP_ENABLED=true \ 
        -p 16686:16686 \ 
        -p 4317:4317 \
        -p 4318:4318 \ 
        jaegertracing/all-in-one:1.40

Next is setting up our Infinispan cache,

<distributed-cache name="balance" mode="SYNC" remote-timeout="30000" statistics="true">
    <encoding media-type="text/plain"/>
    <locking concurrency-level="1000" isolation="READ_COMMITTED" acquire-timeout="60000" striping="false"/>
    <transaction mode="NON_XA" auto-commit="true" stop-timeout="30000" locking="PESSIMISTIC" reaper-interval="30000" complete-timeout="30000" notifications="true"/>
    <state-transfer timeout="30000"/>
</distributed-cache>

And dont forget to put this Java runtime variables on our Infinispan,

JAVA_OPTS="$JAVA_OPTS -Dinfinispan.tracing.enabled=true -Dotel.service.name=infinispan-server
            -Dotel.exporter.otlp.endpoint=http://localhost:4317 -Dotel.metrics.exporter=none"

We can run this app, and see the result on our Jaeger dashboard.

And this is the detail traces within one same request,

Code for this article can be found on below Github link

https://github.com/edwin/spring-boot-infinispan-and-jaeger

Have fun.

Spring Boot and Java Melody Stopwatch

Sometimes we need to measure how long does a java process or a specific method take. We can use some traditional method like below to do that but it wont be too elegant

private void someMethod() {
	Long timestamp = System.currentTimeMillis();
	// do some process
	logger.info(System.currentTimeMillis()-timestamp)
}

It looks good but we are unable to generate a report or statistics for this. And this is where Java Melody’s Stopwatch comes into the picture. It can measure the time needed for a specific process and generate report and statistics for it.

This is how it works,

public class RestService {
    public void callRestAPIOne() {
        try (Stopwatch stopwatch = new Stopwatch("stopwatch-for-one-todo")) {
            try {
                HttpRequest request = HttpRequest.newBuilder().uri(new URI("https://jsonplaceholder.typicode.com/todos/1"))
                        .GET().build();
                System.out.println(HttpClient.newHttpClient().send(request, HttpResponse.BodyHandlers.ofString()).body());
            } catch (Exception ex) {
                ex.printStackTrace();
            }
        }
    }

    public void callRestAPITwo() {
        try (Stopwatch stopwatch = new Stopwatch("stopwatch-for-users")) {
            try {
                HttpRequest request = HttpRequest.newBuilder().uri(new URI("https://jsonplaceholder.typicode.com/users"))
                        .GET().build();
                System.out.println(HttpClient.newHttpClient().send(request, HttpResponse.BodyHandlers.ofString()).body());
            } catch (Exception ex) {
                ex.printStackTrace();
            }
        }
    }

    public void callRestAPIThree() {
        try (Stopwatch stopwatch = new Stopwatch("stopwatch-for-posts")) {
            try {
                HttpRequest request = HttpRequest.newBuilder().uri(new URI("https://jsonplaceholder.typicode.com/posts"))
                        .GET().build();
                System.out.println(HttpClient.newHttpClient().send(request, HttpResponse.BodyHandlers.ofString()).body());
            } catch (Exception ex) {
                ex.printStackTrace();
            }
        }
    }
}

And it shall generate report like this,

Integrating Infinispan, Prometheus, and Grafana

Infinispan 14, or its supported product which is Red Hat DataGrid 8.4, is already having a metrics endpoint API to be parsed and visualized. And on this article, we are trying to integrate those metrics with Prometheus and Grafana, and Generate a dashboard to displayed its statistics in almost real-time update.

The highlevel design perhaps would looks like this,

First we can start by starting 3 different Infinispan instances, we can use multiple ways of doing this such as with docker or podman, but for this scenario im creating 3 different folders which each contains a Red Hat DataGrid instances. Make sure to create a port offset to prevent their port from colliding, and change the servername for an easier maintenance.

$ cd ~/Documents/redhat-datagrid-8.4.6-server-1/bin
$ ./server.sh -c infinispan.xml

$ cd ~/Documents/redhat-datagrid-8.4.6-server-2/bin
$ ./server.sh -c infinispan.xml

$ cd ~/Documents/redhat-datagrid-8.4.6-server-3/bin
$ ./server.sh -c infinispan.xml

Once all those 3 started, we can try to login to one server and see wheter those 3 servers already form a cluster.

we can start by creating replicated or distributed caches on top of our newly created Infinispan cluster.

Next is creating Prometheus instance, and to make this activity easier, we are going to using Podman. Lets start with a prometheus.yaml file first, in here we need to define the location of our Infinispan instances. Im using “host.containers.internal” because Prometheus is running on a container, and going to access Infinspan instances which are running on the host instance.

# my global config
global:
  scrape_interval: 15s 
  evaluation_interval: 15s 
  

# Alertmanager configuration
alerting:
  alertmanagers:
    - static_configs:
        - targets:
          # - alertmanager:9093

scrape_configs:  
  - job_name: "ispn01"
    static_configs:
      - targets: ["host.containers.internal:11222"]
  - job_name: "ispn02"
    static_configs:
      - targets: ["host.containers.internal:11223"]
  - job_name: "ispn03"
    static_configs:
      - targets: ["host.containers.internal:11224"]

And run our Prometheus using Podman,

podman run \
           -p 9090:9090 \
           -v /Users/Shared/prometheus.yml:/etc/prometheus/prometheus.yml \
           --network shared  \
		   prom/prometheus

We can validate whether our Prometheus runs well or not by accessing it page and do some queries,

Once successfully started, we can continue by installing our Grafana instance using Podman,

podman run  \
			-p 3000:3000 \ 
			--network shared \  
			grafana/grafana-enterprise

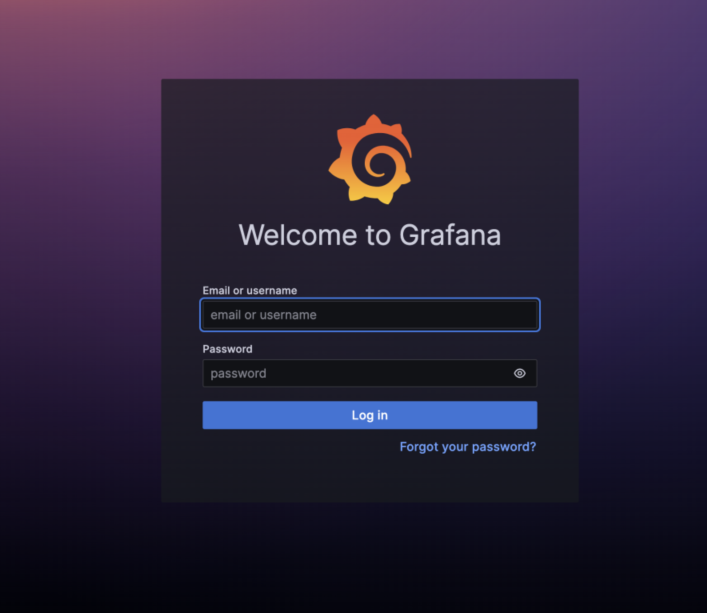
After that, we can access Grafana Dashboard directly

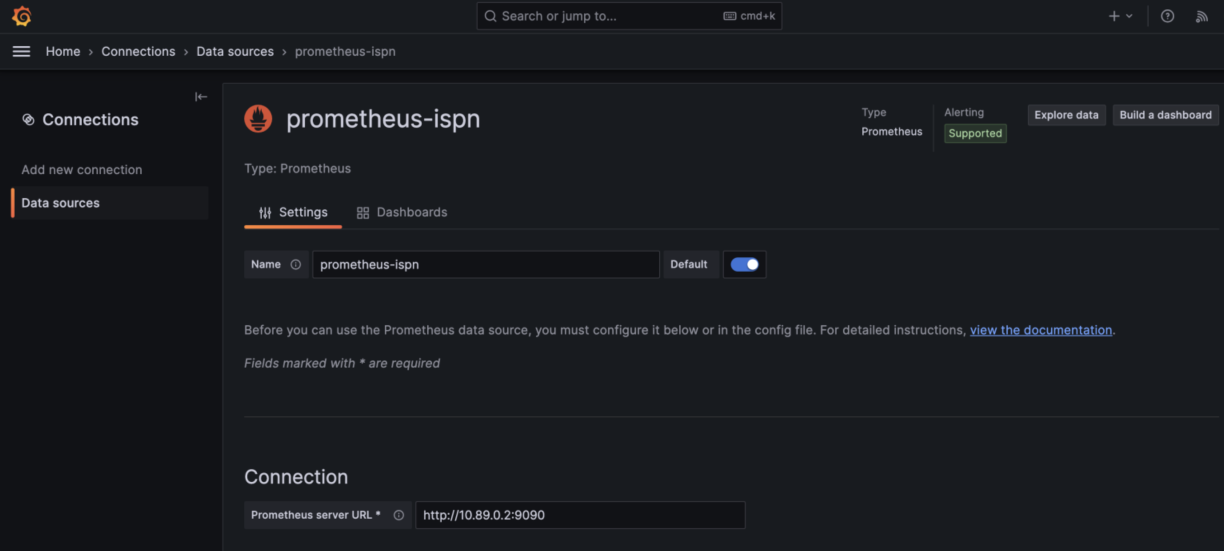
Next is setting-up Prometheus Datasource inside Grafana, where we need to put the name of our datasource, and also its connection URL. For this sample, we are putting Prometheus container’s IP inside.

Make sure we copy the uid of this Datasource (we can see it at the browser’s URL), since we are going to use it in the dashboard.

Next is to create a new Grafana Dashboard for Infinispan, we can use import functionality to import existing dashboard in the form of a json file. For this sample, we can download from below Github repository.

https://github.com/edwin/infinispan-grafana-dashboard/

Dont forget to replace the existing hardcoded datasource uid with our existing Datasource uid

"datasource": {
        "type": "prometheus",
        "uid": "eb756797-79c7-4893-bcc9-c4bfdc7c457d"
      },

Save, and we can see our Grafana Dashboard

Unable to Start Podman on Mac

Just recently had below error when trying to run podman in my mac machine

$ podman machine start
Starting machine "podman-machine-default"
Waiting for VM ...
   Error: qemu exited unexpectedly with exit code 1, 
   stderr: qemu-system-x86_64: cannot create PID file: Cannot lock pid file: Resource temporarily unavailable

Workaround is quite simple, we can run this command

$ ps -edf | grep qemu-system | grep -v grep | awk '{print $2}' | xargs -I{} kill -9 {}; podman machine stop

And run podman again

$ podman machine start
Starting machine "podman-machine-default"
Waiting for VM ...
Mounting volume... /Users:/Users
Mounting volume... /private:/private
Mounting volume... /var/folders:/var/folders

Reference :

https://github.com/containers/podman/issues/16054