Just several days ago, my application was down because of OutOfMemoryError, and I haven’t got a clue what the root cause is. That’s why I’m looking for a way on how to find the culprit when my application is down again. So im using this jvm parameter to dump all the object on memory when OutOfMemoryError happen.
-XX:+HeapDumpOnOutOfMemoryError -XX:HeapDumpPath=E:\ -Xmx10m -Xms10m
For example, im using this java class to simulate OutOfMemoryError,
package mybatistesting;

import java.util.ArrayList;
import java.util.List;

public class MyBatisTesting {

    public static void main(String[] args) throws Exception {
        List list = new ArrayList();
        for (int i = 0; i < 10000000000l; i++) {
            list.add(i+""+i+""+i);
            if(i%1000==0)
                System.out.println("adding -- "+i);
        }
    }
}
As you can see on your console log,
java.lang.OutOfMemoryError: GC overhead limit exceeded
Dumping heap to E:\java_pid5812.hprof ...
Heap dump file created [15155736 bytes in 0.237 secs]
You can open java_pid5812.hprof using your preferable application, for example using Eclipse MAT or JProfiler.


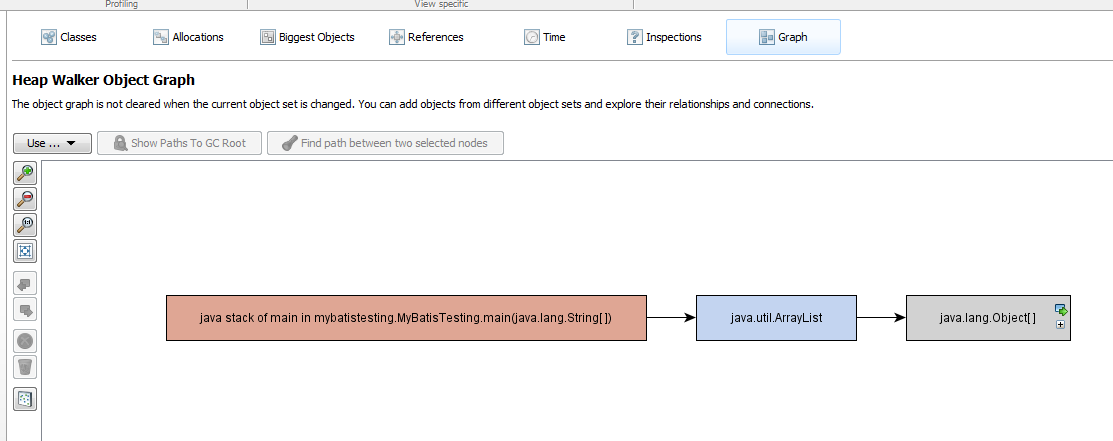
Have fun 😉